Measurement of frequency characteristics
On measurement of frequency characteristics
We summarized points to be noted when measuring frequency characteristics by combining
WaveSpectra (WS) and sister software WaveGene (hereinafter referred to as WG).
The method of measuring frequency characteristics with WS + WG is as follows.
(1) A method that uses a cyclic sweep with a user waveform of WG (V1.40).
(2) A method using a direct WG sweep signal. (Method using WS peak hold function)
Normally, the method of (1) is recommended because it is easy to obtain accurate frequency characteristics in a short time.
This method can be used in most cases, such as characteristics when the sound device itself is loop connected, external circuit such as an amplifier connected to the sound device, simple measurement of the speaker via the amplifier / microphone, etc. (When direct response can be obtained in real time)
For details, please refer to the help of WG.
(1) can not be used, for example, when the response is not returned in real time, such as the recording / playback characteristics of the sound recording device, the method using the peak hold function of (2) general sweep signal + WS will be used .
However, in this case, there are points to note such as setting on the WG side.
(1) Setting sweep signal of WG
When using the sweep signal in combination with WG to measure the frequency response using the peak hold function of WS, pay attention to the sweep speed.
Originally, in order to obtain the correct value by FFT, it is necessary that the signal is constant and does not change for the time corresponding to the number of sample data. In the case that it is changing, the real value is not obtained.
In the case of Log sweep, the higher the frequency, the greater the rate of change, so it will be measured with the characteristic degraded as you go to the higher range.
(We sometimes see measured data posted on the web, magazines, etc. (^ ^;)
In order to eliminate this lowering of the high frequency,
Linear Sweep instead of Log Sweep Note 1: Please use it.
Although it decreases, it can be reduced to a certain level over the entire frequency range.
Even with the Log sweep, if the number of sample data is decreased or the sweep time is made sufficiently long due to the influence of the window function, there may be cases where the lowering of the high frequency is almost eliminated, but it is not originally a correct measurement.
It is recommended that you grasp the extent of degradation by directly playing back the wave file of the original sweep signal before passing through the measurement object.
Next is the sweep speed, but for accurate measurement it is necessary to change at a sufficiently slow speed.
Let's seek rough estimates of how fast to sweep.
If we decide to render with the original resolution of FFT, for example,
4000 <4800 Hz , the number of FFT sample data N = , the frequency resolution is 48000/4096 = 11.72 Hz.
When analyzing to 20 to 20000 Hz with this resolution, the analysis time of FFT is the reciprocal of the frequency resolution 00853 seconds,
Therefore, assuming that it is almost good if you move at intervals of 11.72 Hz every 0.0853 seconds,
(20000-20) / 11.72 * 0.0853 = 145 seconds
To summarize the expression,
Note 2: sweep time = sweep frequency width * N * N / Fs / Fs
In this case, it takes about two and a half minutes to 20 kHz, and so on.
In the case of FFT sample data number 8096 , about four times if required.
In the case of FFT sample data number 16384 , many more times required.
Actually, since the resolution of the window function is several times the FFT resolution, it can only be plotted with the widened width, so it can not be analyzed with the resolution above even if it takes much time.
It will take quite a lot of time, but how is it?
(In addition, if you do not need such a resolution, you can shorten it by knowing that original resolution can not be obtained.)
Below, an actual example of the change in resolution by sweep speed is shown.
(2) Resolution at peak hold of WS due to difference in speed of WG sweep signal
I inserted a Twin-T notch filter circuit between the input and output of the sound device and examined to what extent the dip can be detected correctly.
WG Linear sweep-& gt; Sound output-& gt; Notch filter-& gt; Sound input-& gt; WS peak hold
It shows the original frequency characteristics of the filter. (By cyclic sweep)
It is a dip of about -30 dB.
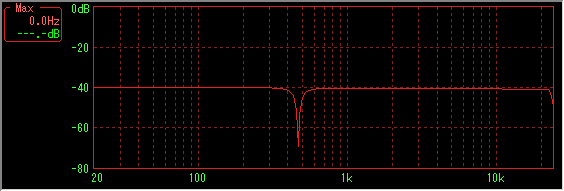
[When FFT sample data number and sweep time are changed]
Sweep time is the optimum time according to the formula in (1)? It is.
(The blue line is the correct characteristic for comparison, it has been paused at about 1 kHz daringly)
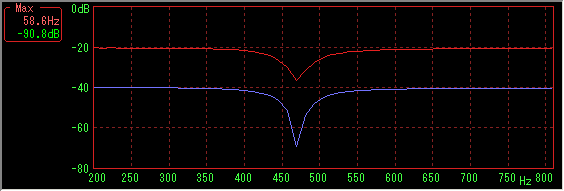
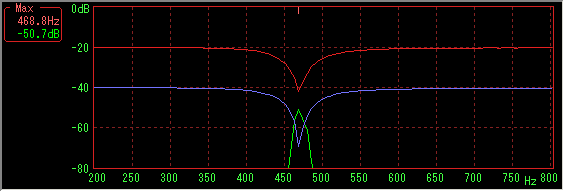
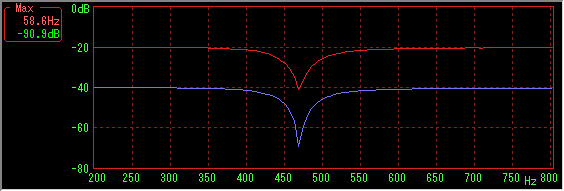
Sample data number 4096, Hanning window, sweep time is 10 to 2000 Hz for 15 seconds (44 fps)
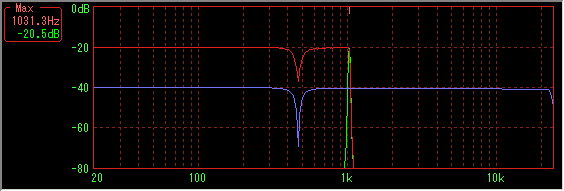
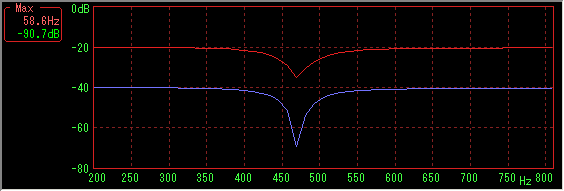
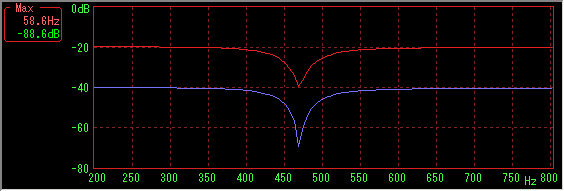
Number of sampled data 8192, Hanning window, sweep time is 10 to 2000 Hz 58 seconds (38 fps)
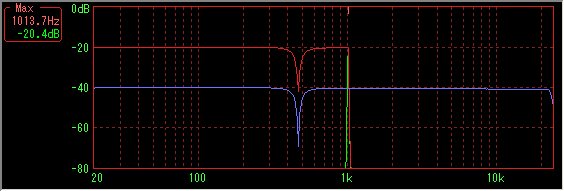
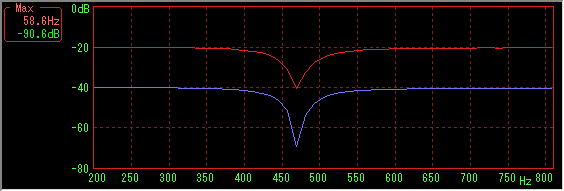
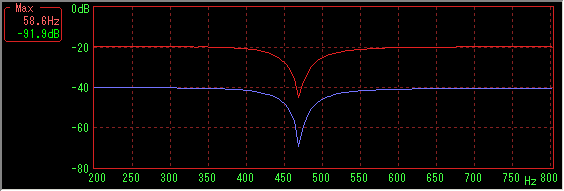
Number of sample data 16384, Hanning window, sweep time is 10 to 2000 Hz for 230 seconds (30 fps)
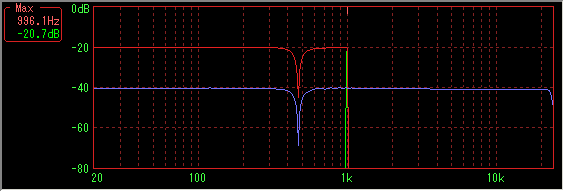
Again, the larger the number of sample data (and sweep time), the better the result.
[Enlarged near the dip to make it easy to see]
In addition to the sweep speed, the resolution also decreases depending on the characteristics of the window function.
It shows the difference.
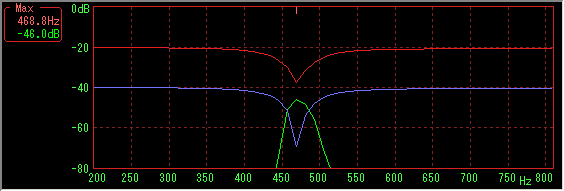
Sample data number 4096, Hanning window, sweep time is 10 to 2000 Hz for 15 seconds (44 fps)
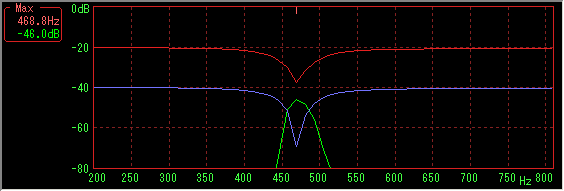
Green line is the spectrum when pausing in accordance with the dipped position in the middle of sweep.
It seems that a nearly correct dip is detected as seen from the level.
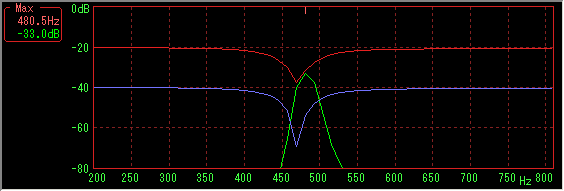
However, you can see that the dips are filled and disappear by filling the base of the window function at the rising and falling parts on both sides.
Likewise,
Sample data number 8192, Hanning window, sweep time is 10 to 2000 Hz 58 seconds (38 fps)
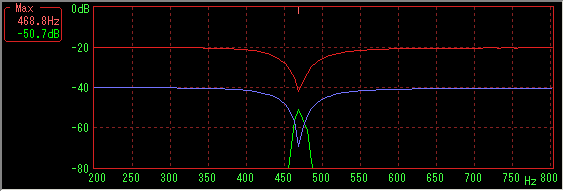
Green line is the spectrum when pausing in accordance with the dipped position in the middle of sweep.
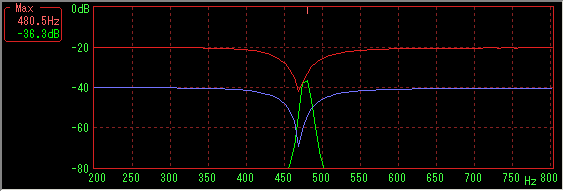
Likewise, you can see that the dips are filled and lost on both sides.
[Difference by window function]
Difference in the degree of dip filling depending on the type of window function. See
|
Window function |
Number of sampled data 4096, sweep time is from 10 to 2000 Hz 15 seconds |
width of main lobe |
|
Hanning |
|
Double the rectangular window |
|
Blackman |
|
3 times rectangular window |
|
Blackman |
|
4 times rectangular window |
|
None (Rectangle) |
|
This degree of dip |
Likewise, in the case of sample data number 8192
|
Window function |
Number of sample data 8192, sweep time is from 10 to 2000 Hz 58 seconds |
|
Hanning |
|
|
Blackman |
|
|
Blackman |
|
|
None (Rectangle) |
|
Hanning window seems to be the best for the time being.
Created with the Personal Edition of HelpNDoc: Free EPub producer
