Spectrum
[Spectrum] tab
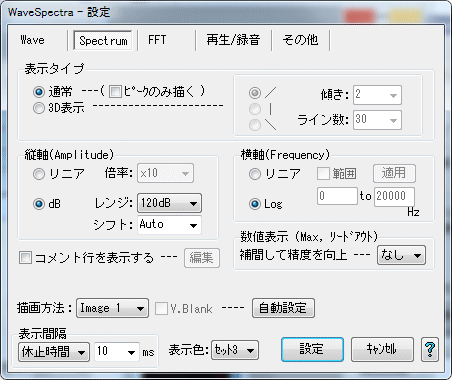
Spectrum Configure settings related to waveform display.
* If you click the position of a button, a combo box, etc. in the figure below, it jumps to the explanation of that part.
normal
- This is a normal Spectrum display.
- Draw only peaks
When checked, only the peak of Spectrum is connected and the waveform is displayed.
If the display density of the graph is high and multiple data actually correspond to one dot on the screen (for example, where the horizontal axis is the part where the frequency of Log display is high), the graphs will not overlap, which makes it easier to see .
(The display is also slight, but it gets faster.)
*However, because the number of display data decreases, there will be a part that will display slightly different from original.
3D display
- Multiple 3D display of Spectrum in 3 different directions.
- Direction(/, |, \)
Specify from the upper right, upper, upper left, the direction of extension of the graph of 3D display. - slope
Specify the horizontal deviation of each adjacent graph in dot units.
The larger the value, the larger the angle.
*Since the end of the graph is drawn to pass through the corner at the top, the larger the slope, the more horizontal The length of the direction will become shorter.
(However, since it is designed not to be less than half of the size of the display window, if it becomes more inclined, it does not pass through the upper corner.) - Number of lines
Specify how many graphs to draw in the vertical direction.
However, since it is necessary to set the actual graph drawing intervals at equal intervals (integral), depending on the display window size, the specified graph drawing intervals are set as follows:* It may not be the number of lines.
The actual number of lines is "31 L" on the upper left of the 3D display, And it will be displayed.
Also, at the same time, the seconds of how many lines it corresponds is also displayed.
*If you change the window size due to limitations of the drawing method, be careful Please.
(It is the same while stopping)
Note 1:
In 3D display, in order to make it easy to see, in normal mode The graph is drawn only in the same way as when checked, regardless of whether "" draw only peak " is checked or not.
Also, whichever type of drawing method is checked, it will always be drawn only by the method of Image 1, so depending on the graphics environment, drawing is very slow if it is enlarged by maximizing the window etc. You may.
Note 2:
You can not move to measurement mode during 3D display.
=== Vertical axis (Amplitude) ===
Linear
- Select this when you want to display the amplitude data of the Spectrum waveform as it is.
- Magnification
Spectrum Sets the display magnification of the amplitude data of the waveform.
dB
- Spectrum Select when you want to display the amplitude data of the waveform in dB.
- Range
DB Select the display range.
A range of 10 to 180 dB, and +1 dB, + - 3 dB, + - 10 dB You can select.
+ - 1 dB, + - 3 dB, + - 10 dB is used for enlarging and displaying near 0 dB in combination with the lower shift. - Shift
Select the value to shift the display waveform.
Auto, 0 dB, 6 to 18 dB, Norm, Norm 100, Norm 1 k, Norm 10 k You can select, but by inputting from the keyboard you can choose any dB value You can set 0 to 200 (real number).
*Auto mode
Even if any window function is used, it is automatically corrected so that the value of the maximum amplitude Sin wave becomes 0 dB.
Normally it should be Auto.
*Normalize mode
Norm: The maximum value of the spectrum is always fixed to 0 dB.
Norm 100: Fixes the spectrum of 100 Hz (frequency closest to) to 0 dB at all times.
Norm 1k: Fixes the spectrum of 1 kHz (frequency closest to) always to 0 dB.
Norm 10k: The spectrum of 10 kHz (frequency closest to) is always fixed to 0 dB.
It is convenient when you want to display relative values only, such as when measuring frequency characteristics such as impulse response, in an easy-to-understand manner. It is convenient to use in combination with +1 dB, + - 3 dB, + - 10 dB etc. of the upper range.
=== Horizontal axis (Frequency) ===
Linear
- Select this when you want to display the frequency axis of the Spectrum waveform as it is.
*Although the lower limit is 20 Hz in Log below, You can display up to DC components.
When it is necessary to display below 20 Hz, this Please be linear. - Range
If not checked, all frequency components are displayed.
When checked, frequency components in an arbitrary range can be displayed.
Set the range with two edit boxes, then click the Apply button Press it and it will be displayed in that range.
*Input box 0 in the edit box becomes the direct current component.
*The specified range is an integer multiple of the frequency resolution at that time and is displayed to include that range.
That is, the points at the left and right ends of the graph always match a certain point of the frequency sample.
Log
- Select to logarithmically display the frequency axis of the Spectrum waveform.
*When displaying logarithm, always set the sampling frequency 2(??) is the upper limit, and 20 Hz is the lower limit frequency.
When you want to display
20 Hz or less, please make linear display.
=== Display comment lines, Edit ===
- If you check here, the Spectrum display area will be slightly lowered and comment lines will be displayed at the top.
After the comment, the current sampling frequency (Fs), the number of FFT data samples (N), the frequency resolution (Fs / N Hz) is also displayed.

- When displaying the comment line, the edit button becomes effective, so pressing it will open the comment edit window and you can edit the contents of the comment.
Up to three comment lines can be stored.
Also, sampling frequency, number of FFT sample data, frequency resolution You can also choose whether or not to show.
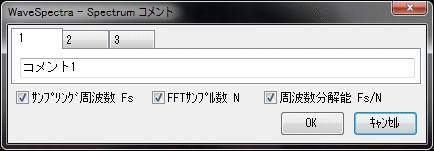
- You can also open the comment edit window by right-clicking not only the edit button but also the comment display itself of the Spectrum display area.
=== Number display (Max, lead out) ===
Interpolation to improve accuracy
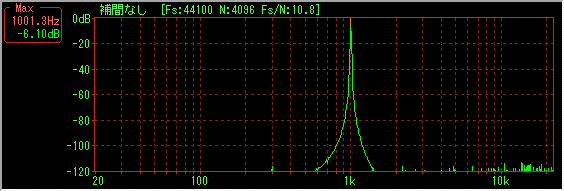
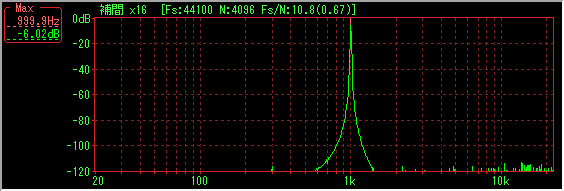
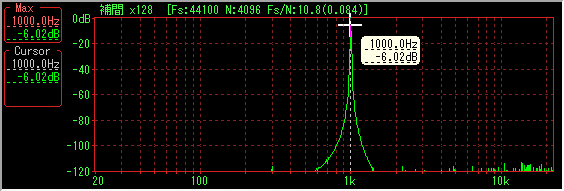
- Max display in measurement mode and lead out , The accuracy of the display of frequency and amplitude is improved from the frequency resolution determined by the current sampling frequency and the number of FFT sample data.
By interpolation calculation, the precision increases by 16 times for x16, 128 times for x128, and so on.
(Since the FFT calculation of 128 points at x16 and 1024 points at x 128 is added, the CPU load increases by that amount.)
Also, interpolation calculation hidden between frequency resolution? Since it is only to find the original peak, it does not mean that the spectrum itself becomes sharp and displayed as it is when you increase the number of FFT sample data.
Note that when interpolated, Max and lead out The underline of the dotted line is displayed for the numerical value part of. (Lower figure)
|
|
*sampling frequency 44,100 Hz, number of FFT data samples 4096, frequency resolution 10.8 Hz |
|
|
|
|
No interpolation |
|
|
|
interpolation x 16 |
|
|
|
interpolation x 128 |
|
|
*If the lead out and display of the cursor position are also interpolated, it will be underlined with a dotted line. |
|
- The following six types of drawing methods can be selected.
Select the fastest drawing method (the least CPU utilization) in your environment.
(Depending on the display card, there may be little change, but on the contrary it may be very different so please try.)
Screen: Direct drawing on screen
Image 1: Drawing in the image in the memory and transferring to the screen
Image 2: Transfer the image drawn only to the screen to the screen, draw only the line directly
DDraw 1: DirectDraw version of Image 1 method
DDraw 2: DirectDraw version of Image 2 method
DDraw 3: Transfer after synthesizing to another image instead of screen by DDraw 2 method
Depending on the window size and number of colors, One of the drawing methods in which V. Blank is effective should be the fastest.
(Independent floating window for Lissaoujou display is drawing method of Image 2 even if it is set to 3 types of DDraw)
=== V.Blank ===
- When the drawing method is Screen, Image 2, DDraw 2, the screen flickers.
In that case, if you check here and make it effective, you will draw after waiting for the vertical retrace period, so flicker disappears.
However, in the case of a large window size or a slow CPU, flickering may be left behind without being written during the flyback period, and since it will wait until then, Please note that the utilization rate may become 100%.
Also, depending on the display driver, there seem to be software emulation, in that case, there is no effect.
*This function is originally a function for CRT display set at a high refresh rate.
Liquid crystal display, it seems to be 60 fps in general, so it may just be late.
=== automatic setting ===
- By pushing this button, the setting window opens and you can automatically set the combination of drawing methods that will be the fastest.
If you do not understand the combination, it is convenient to set it automatically with this button.
Even if you press this button (Spectrum tab) Both Wave and Spectrum are set at the same time.
*If there is a drawback in the drawing due to a bug in the driver etc. with the combination set by automatic setting, try changing the setting manually.
* Please refer to the same section of the [Wave] tab .
=== Display Interval ===
=== display color ===
See [Miscellaneous] tab.
*All display setting functions can be changed in real time even during calculation & display.
~~~~~~~~~~~~~~~~~~~~~~~~~~~~~~~~~~~~~~~~~~~~~~~~~~~~~~~ ~~~~~~~~~~~~~~~~~~~
When closing the setting dialog box, When you press the [Cancel] button and close it, all settings up to that point will return to the state when the dialog box was opened.
Therefore, you can temporarily make another setting.
All settings of the main window, including settings in the setting dialog, are all set in the setting file It is stored inWS.INI(WS - 2. INIforWaveSpectra: 2for the second) and reproduced at the next start It will be.
Created with the Personal Edition of HelpNDoc: Free EBook and documentation generator
