Wave
[Wave] tab
Wave Configure settings related to waveform display.
* If you click the position of a button, a combo box, etc. in the figure below, it jumps to the explanation of that part.
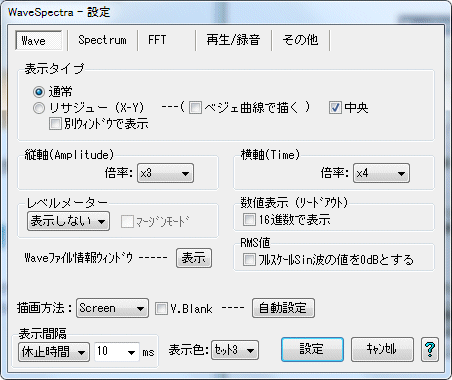
normal
- It is a normal waveform display.
Lissajous (X - Y)
- This is the Lissajous (X - Y) display in Stereo Lch / Rch.
It is useful for phase checking during recording, microphone arrangement check and so on.
Lch is set to Y axis, Rch is set to X axis.
The display window at this time is always square.
*For multi-channel format here . - Draw with Bezier curve
When checked, draw the Lissajous waveform with a Bezier curve.
Normally, being connected by a straight line may become connected a little smoothly. (It will be late, though slightly) - Center
When checked, it is always displayed in the middle of the window. - Display in new window
If checked, it will be displayed in a separate, independent floating window.
If this is already checked during lissajous display, the wave display window will change to the normal waveform display.
*You can of course change the position and size of the floating window.
Move: Drag anywhere in the window.
Resize: Drag the lower right corner of the window (here only).
(Please be careful as it can be changed only to a square)
Also, by setting the floating window with the Move with the main window
along the [Others] tab - Maintain the relative position when moving the main window. You can move at the same time.
=== Vertical axis (Amplitude) ===
- magnification
- Wave Sets the display magnification of the amplitude data of the waveform. When
x1, all data up to the maximum amplitude are displayed.
=== Horizontal axis (Time) ===
magnification
- Wave Sets the display magnification of the waveform's time axis. When
x1, all of the sample data number being FFTed is displayed.
Not displayed, display (horizontal), display (vertical)
- In the display (horizontal) and display (vertical), they are displayed in separate horizontal and vertical directions, respectively, in separate independent floating windows.
*You can of course change the position and size of the floating window.
Move: Drag anywhere in the window.
Resize: Drag each corner of each side like an ordinary window.
(However, there is a limit on the size of the shorter side for both horizontal and vertical display, it can not be larger than that)
Also, by setting the floating window with the Move with the main window
along the [Others] tab - Maintain the relative position when moving the main window. You can move at the same time.
|
|
|
|
|
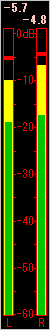
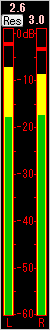
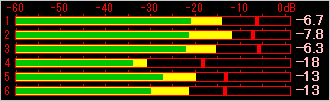
- *In addition to the normal peak meter, the level meter shows the power inside it The RMS value (effective value) bar is also displayed.
This is what I meant to be a substitute for the so-called VU meter.
Since the real VU meter has different mechanisms, the movement is not the same, but it is a guideline, but the displayed value itself is an accurate RMS value.
(In fact, it is displayed with a slightly multiplied mean value filter)
* See the RMS value below
Margin mode
- When checked, the normal peak value display mode changes to the margin display mode.
The margin value is retained until you press the Reset button.
|
|
|
|
|
- In case of multi channel with more than 3 channels, the display height (width in vertical display) increases by the number of channels.
Although the number of channels is displayed for both playback and recording, the number of channels of the level meter immediately after startup is the number of channels set as the recording format.
|
|
|
|
|
=== Wave file information window ===
display
- Pressing the display button indicates the chunk structure and contents of the wave file The Wave file information window opens.
=== Numeric display (lead-out) ===
Display in hexadecimal
- If checked, the value of the waveform at the time of the lead-out is It will be displayed in hexadecimal.
*Pressing the Shift key during the leadout will display the setting opposite to this setting only during that time.
In short, you can switch between decimal and hexadecimal displays.
Set the value of full scale sine wave to 0 dB
- Switches the RMS value of 0 dB between the case of a full-scale rectangular wave and the case of a sine wave.
If checked, the value of the full scale sine wave is set to 0 dB will do.
The setting here affects the RMS value of the measurement mode and the inner RMS bar of the level meter.
*For RMS value of full scale rectangular wave (half scale DC) and RMS value of full scale sin wave, Sin is Since it is smaller by 3.01 dB, if you check here, the display value is reversed It increases by 3.01 dB.
When not checking is the original RMS value, but by measuring only the sine wave, shift of spectrum display If it is set to Auto mode, it may be more convenient to check this if it is the same as the lead-out display of the spectrum.
- The following six types of drawing methods can be selected.
Select the fastest drawing method (the least CPU utilization) in your environment.
(Depending on the display card, there may be little change, but on the contrary it may be very different so please try.)
Screen: Direct drawing on screen
Image 1: Drawing in the image in the memory and transferring to the screen
Image 2: Transfer the image drawn only to the screen to the screen, draw only the line directly
DDraw 1: DirectDraw version of Image 1 method
DDraw 2: DirectDraw version of Image 2 method
DDraw 3: Transfer after synthesizing to another image instead of screen by DDraw 2 method
Depending on the window size and number of colors, One of the drawing methods in which V. Blank is effective should be the fastest.
(Independent floating window for Lissaoujou display, even if it is set to 3 types of DDraw, Image2 It becomes the drawing method of)
=== V.Blank ===
- When the drawing method is Screen, Image 2, DDraw 2, the screen flickers.
In that case, if you check here and make it effective, you will draw after waiting for the vertical retrace period, so flicker disappears.
However, in the case of a large window size or a slow CPU, flickering may be left behind without being written during the flyback period, and since it will wait until then, Please note that the utilization rate may become 100%.
Also, depending on the display driver, there seem to be software emulation, in that case, there is no effect.
*This function is originally a function for CRT display set at a high refresh rate.
Liquid crystal display, it seems to be 60 fps in general, so it may just be late.
=== automatic setting ===
- By pushing this button, the setting window opens and you can automatically set the combination of drawing methods that will be the fastest.
If you do not understand the combination, it is convenient to set it automatically with this button.
Even if you press this button (Wave tab) Both Wave and Spectrum are set at the same time.
*If there is a drawback in the drawing due to a bug in the driver etc. with the combination set by automatic setting, try changing the setting manually.
* Refer to the same section of the [Spectrum] tab.
=== Display Interval ===
=== display color ===
See [Miscellaneous] tab.
*All display setting functions can be changed in real time even during calculation & display.
~~~~~~~~~~~~~~~~~~~~~~~~~~~~~~~~~~~~~~~~~~~~~~~~~~~~~~~~~~~~~~~~~~~~
When closing the setting dialog box, When you press the [Cancel] button and close it, all settings up to that point will return to the state when the dialog box was opened.
Therefore, you can temporarily make another setting.
All settings of the main window, including settings in the setting dialog, are all set in the setting file It is stored inWS.INI(WS - 2. INIforWaveSpectra: 2for the second) and reproduced at the next start It will be.
Created with the Personal Edition of HelpNDoc: Full-featured Kindle eBooks generator