Read-out
Read-out
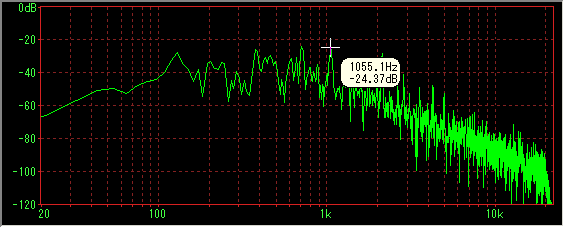
Mouse cursor during pause Wave / Spectrum When you move to the display window, the mouse cursor changes to a cross shape, and you can read the value of the waveform indicated by the center.
(Small display window moves with cursor)
Note:You can not read out in Spectrum 3D display.

*The position of the mouse cursor at this time is only related to reading in the horizontal direction (time axis / frequency axis).
The vertical position of the mouse itself is irrelevant to the displayed value, as the value of the vertical axis of the graph with respect to that position is only read.
*Wave Pressing the shift key during the readout will only You can switch between decimal and hexadecimal display.
You can usually set which to do with numeric display (read out) in the setting dialog.

*When the display density of the graph is high and multiple data actually correspond to one dot on the screen (Spectrum horizontal axis is High frequency part of Log display etc), you can not decide which one of them should be displayed by just hovering over it as above, so you can only read discrete data.
In such a case, the next " automatic peak detection function " It is useful.
automatic peak detection function
Move the mouse cursor closer to the peak (apex) or dip (valley) of the waveform you want to read, click the left mouse button, it will automatically be pulled into that part and the value of that part will be displayed.
It is convenient because it is not necessary to accurately align the mouse cursor.
In addition, since the position of the peak or dip of the data itself in the vicinity is automatically obtained and the cursor is moved to the display position of the corresponding graph again, automatically, the graph is overlapped and it is difficult to read Even the parts can be read accurately.

*If you want to read the part of the peak, slightly above it, when you want to read the part of dip, By placing the mouse cursor and clicking the left button, you can almost certainly go to the target position You can " draw "
*If the display density of the graph is very high, it will deviate from the actual peak or dip when you release the left button.
In this case, please hold down the left button during the readout.
Note: Spectrum display type , " draw only peak " When checking, of course, only the peak part will be detected.
Read-out at improved accuracy
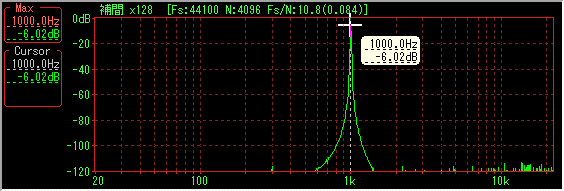
Spectrum Tab of Setting Dialog - Numeric Display (Max, read out) to improve accuracy by interpolation x 16 in combo box Or x 128 is set, the dotted underline is also displayed in the numeric value of the read-out window to indicate that it is interpolated numerical value.

*In this case as well, you need to hold down the left button during the readout.
Created with the Personal Edition of HelpNDoc: Write EPub books for the iPad